HomeIdentifying and understanding reversal patterns
Reversal patterns are those chart patterns which signal a trend reversal in the price of the security. The trend reversal need not be a complete U-turn in prices. Whenever there is a trend reversal, you can expect the old trend to change direction. This means that the prices may take a breather and the prices may consolidate or move sideways. The price does not have to move in the opposite direction, when we say trend reversal. These trend reversals, normally, happens gradually. This implies that there is a shift in the sentiments of trader and there is a chance of change in the direction the price of the scrip.
So, when there is an uptrend, the price may move sideways and the price can continue its uptrend or a new downward trend may begin. Similarly, it is vice-versa when the prior trend is a downward trend.
Let us look at a few key points to identify trend reversals.
Hammer and Hanging Man
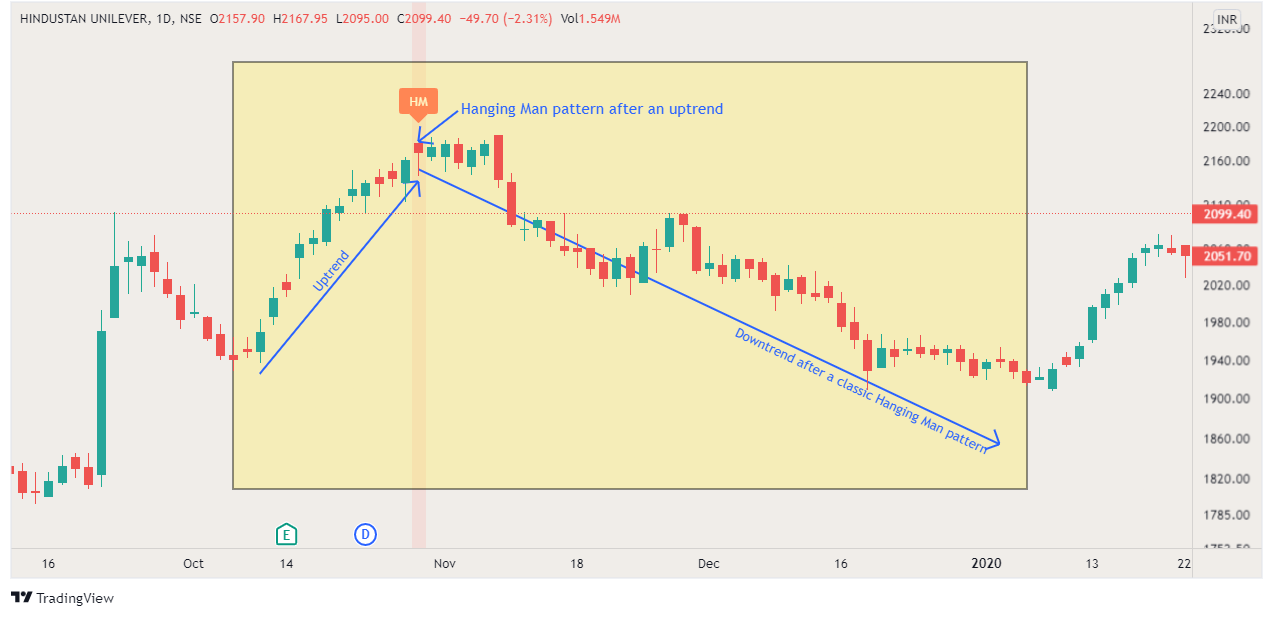
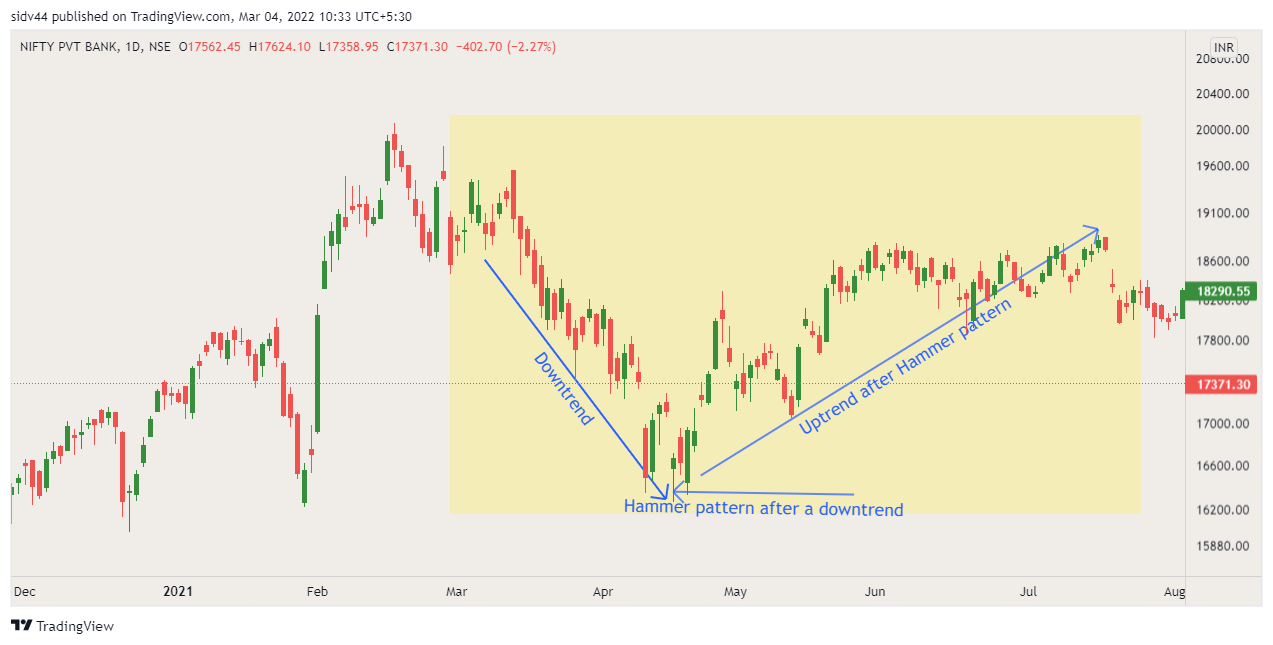
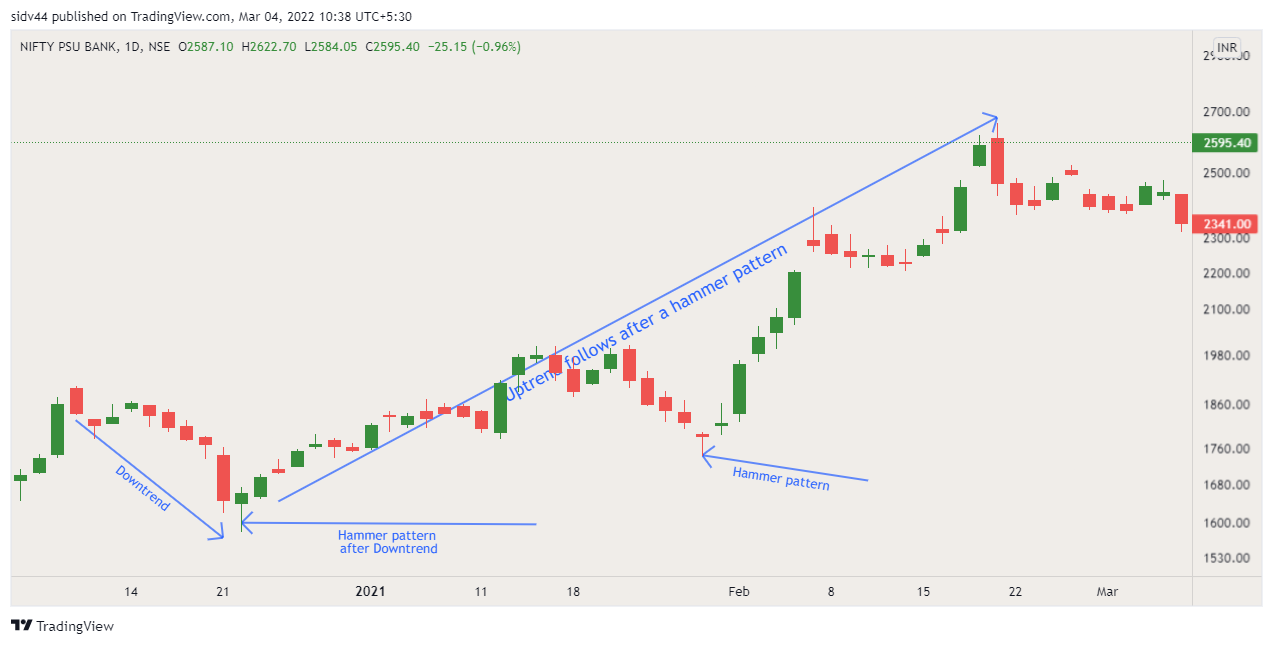
Both the candlesticks look similar. The candlestick will have a small upper body and a long wick which is twice or more than the size of the body. If this kind of candlestick appears during a downtrend then it is called Hammer pattern. If it appears during an uptrend, then it is Hanging Man pattern. The color of the candlestick, whether in an uptrend or downtrend is not important. The candlestick, ideally, must not have any upper wick. In some cases, there may be very tiny upper wick.
If the candlestick has a very long lower wick, small body and no upper wick, then the strength of the bullish Hammer or bearish Hanging Man is really strong. The probability of a trend reversal is higher.
During the downtrend, if the Hammer is green in color, then the price is more bullish than a red Hammer. Similarly a red Hanging Man is more bearish than a green Hanging Man.
While a green Hammer does not need a confirmation candlestick, it is important to have a confirmation candlestick after a bearish red Hanging Man to enter a trade. That’s because, in a red Hanging Man, the price opened at high, fell drastically forming a longer lower wick and then closed near the day’s high. In this scenario, it is prudent for the trade to wait for bearish confirmation candlestick that may be formed after red Hanging Man.
The bearish confirmation candlestick is stronger if it opens below the body of the red Hanging Man and close below the red Hanging Man. This bearish confirmation candlestick is even more strong, if it is a gap-down opening.
Hanging Man pattern
Hammer pattern 1
Hammer pattern 2
Engulfing Patterns
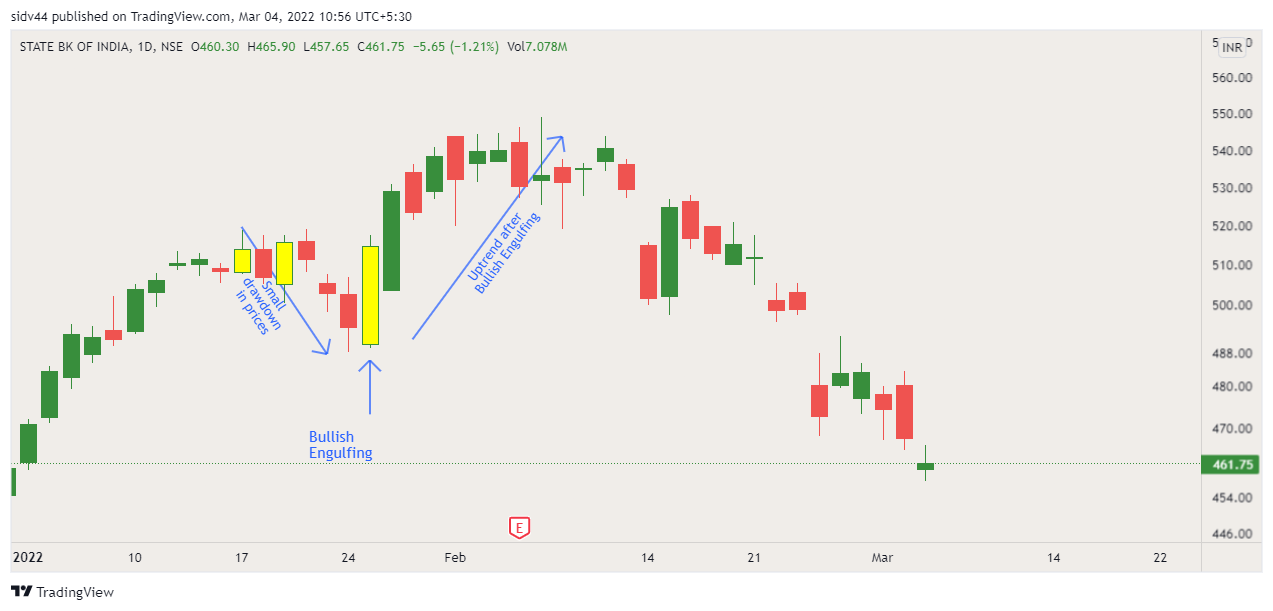
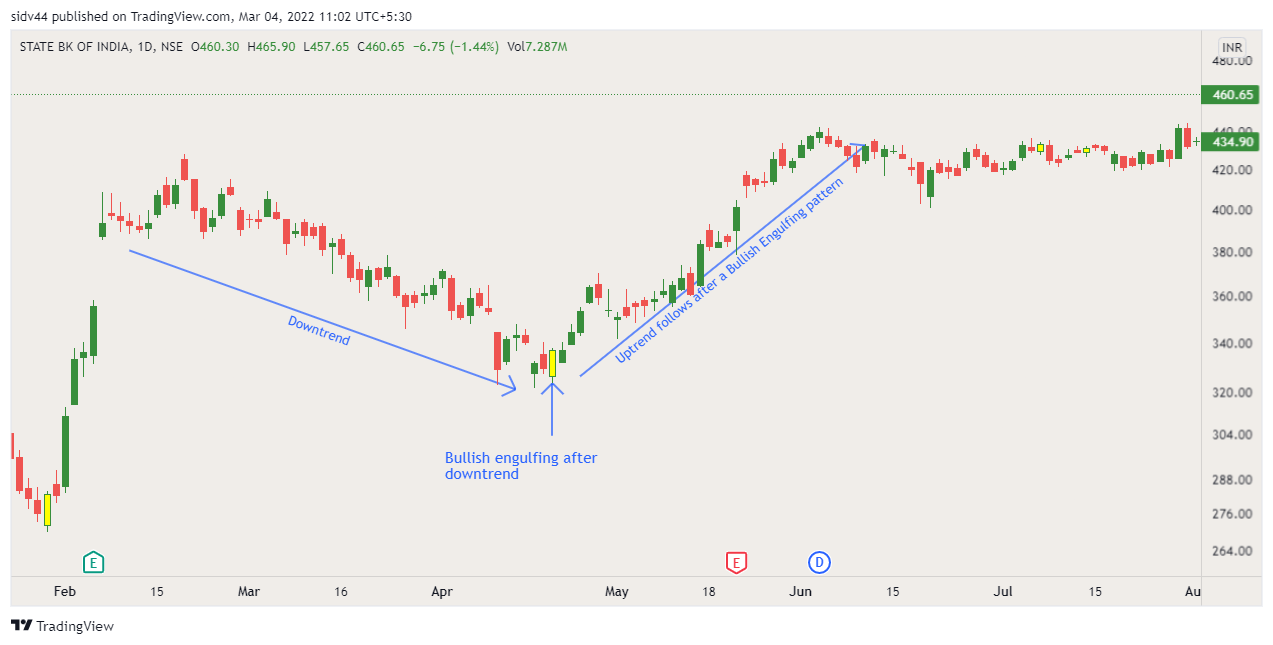
There are two types of engulfing patterns – bullish engulfing and bearish engulfing patterns. It is a candlestick pattern, where we have to look at two consecutive candlesticks together. The two candlesticks must be in opposite color – green and red. Green candlestick being the bullish candlestick and red candlestick being the bearish candlestick.
Here, the 1st candlestick will have upper and lower wicks with a relatively smaller body. The 2nd candlestick should have the opposite color of the 1st candlestick and the body should be really big engulfing the 1st candlestick. Therefore, the body size of the 2nd candlestick will be bigger and longer than the 1st candlestick.
In addition, the markets should be definitely and clearly in a uptrend or downtrend. For a bullish engulfing pattern to work with higher probability, the market should be in a downtrend, because the bullish engulfing pattern is a bottom trend reversal indicator. If a bullish engulfing pattern occurs when the overall market is in uptrend, the chances for a trend reversal is very low and the market may continue its uptrend.
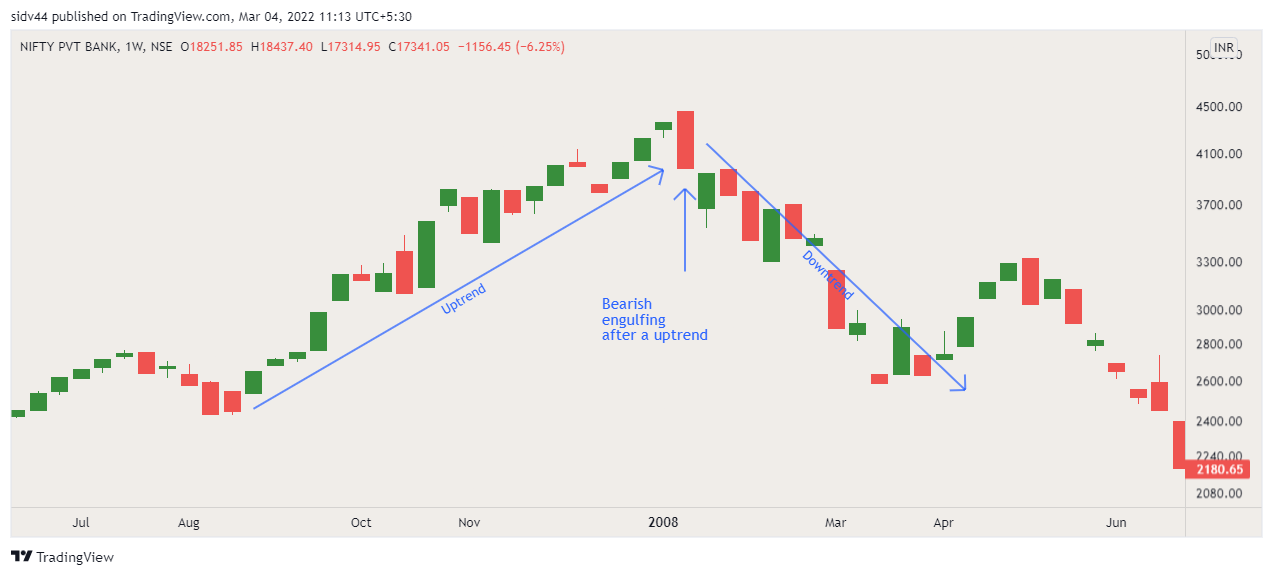
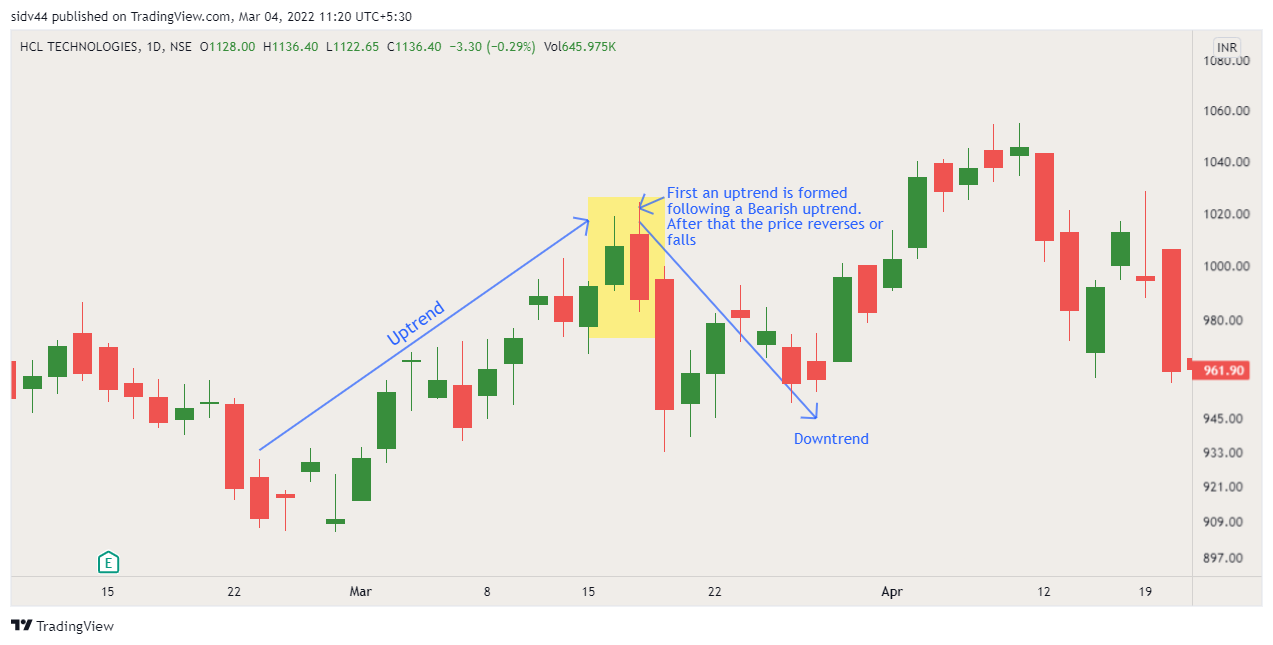
Similarly, for a bearish engulfing pattern to work with higher probability, the market should be in a uptrend, because the pattern is a top trend reversal indicator.
Bullish Engulfing 1
Bullish Engulfing 2
Bearish Engulfing 1
Bearish Engulfing 2
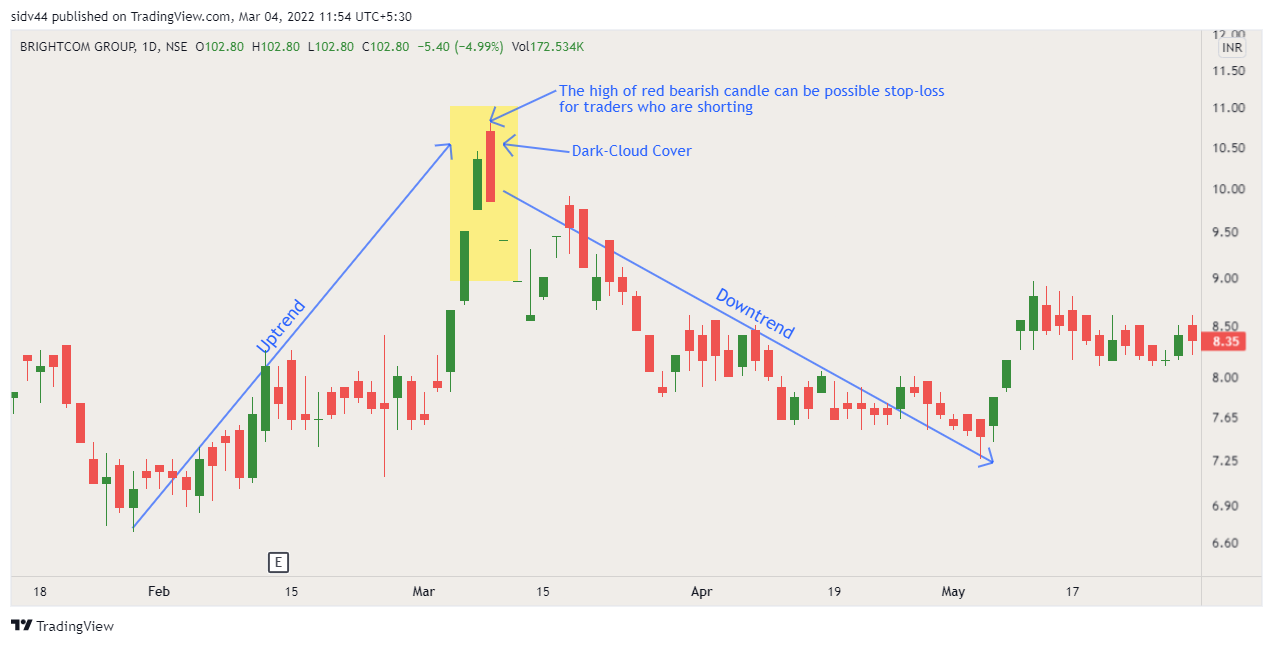
Dark-Cloud Cover
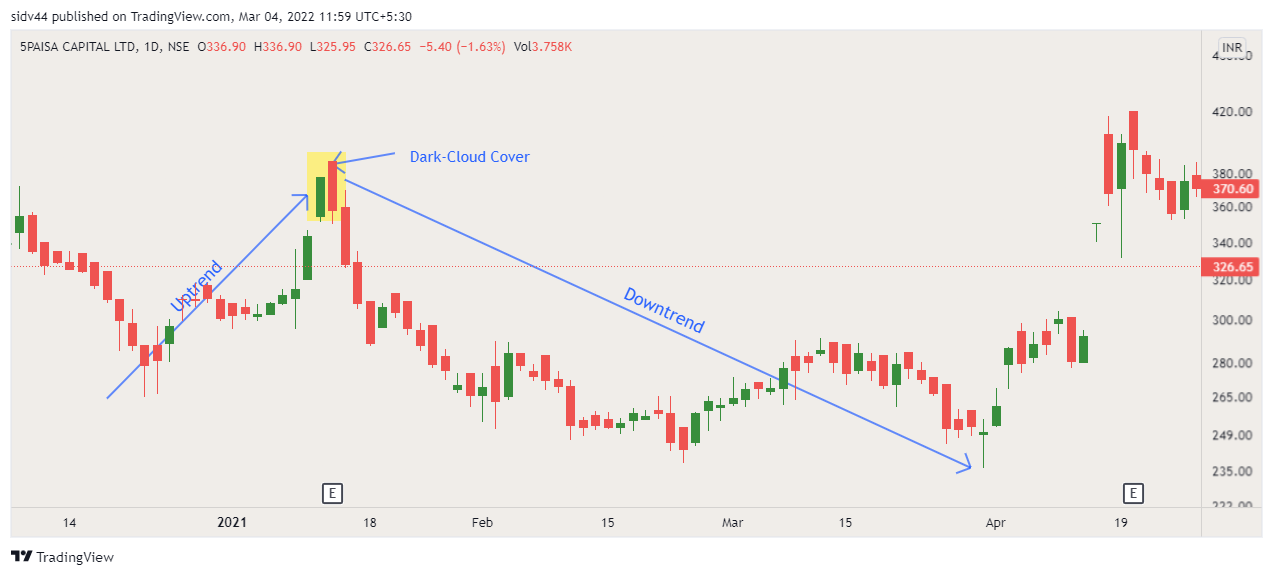
This is another reversal pattern which is a two candlesticks pattern. This pattern should compulsorily have two candlesticks and cannot be viewed separately. The most important criteria to understand and use the pattern is the prior trend must be an uptrend. The 1st candle should be a strong bullish candle. That means, the candle should have a long body with wicks at the bottom and the top.
This bullish candle must be followed by a bearish candle. The bearish candle should be formed in such a way that the opening price of the 2nd bearish candle must be above the highs of the 1st bullish candle. Then, during the course of the day, the price of the 2nd candle must drop significantly and form a strong bearish candle with a long body. The closing price of the 2nd candle must be near the lows of the 2nd candle and well within the prior day’s (1st candlestick) bullish body. In addition, the closing price of 2nd candle must cut and be 50% below the body of 1st bullish candle.
Here, the point to be noted is the closing price of the 2nd candle must not be below the opening price of the 1st candle. If the closing price of the 2nd candle is below the opening price of the 1st candle, then it will resemble like a bearish engulfing. So, this must be remembered by the trader to avoid confusion and differentiate between Bearish Engulfing pattern and Dark-Cloud cover pattern.
However, Bearish Engulfing pattern is a better and more powerful trend reversal pattern compared to Dark-Cloud cover pattern.
Dark-Cloud Cover 1
Dark-Cloud Cover 2
In this situation, traders who want to short can keep the highs of the 2nd bearish candle as stop-loss and use it as a resistance, in case he/she is waiting for a breakout signal.