

Star Patterns involve three set of candlesticks. This is also part of trend reversal patterns and comes with its own set of rules. In a star pattern, the 1st candlestick is a bullish or bearish candlestick, followed by a candlestick with a small body and the 3rd candlestick is a real large body. The color of the star is irrelevant and the colour of the star can be green (bullish) and red (bearish). The star can appear in an uptrend or downtrend. This pattern is applicable for different time frames like minutes, hourly, daily, etc.
There are top and bottom reversal patterns which indicate a likely reversal in the trend. Let us take the different kinds of ‘Star’ reversal patterns
Morning Star
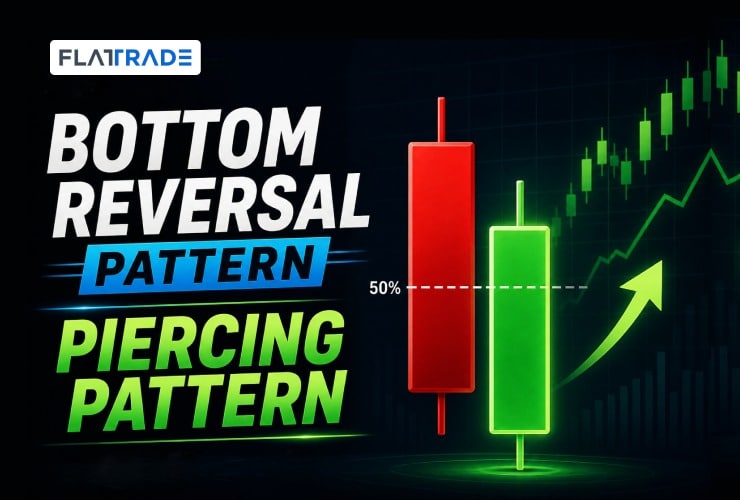
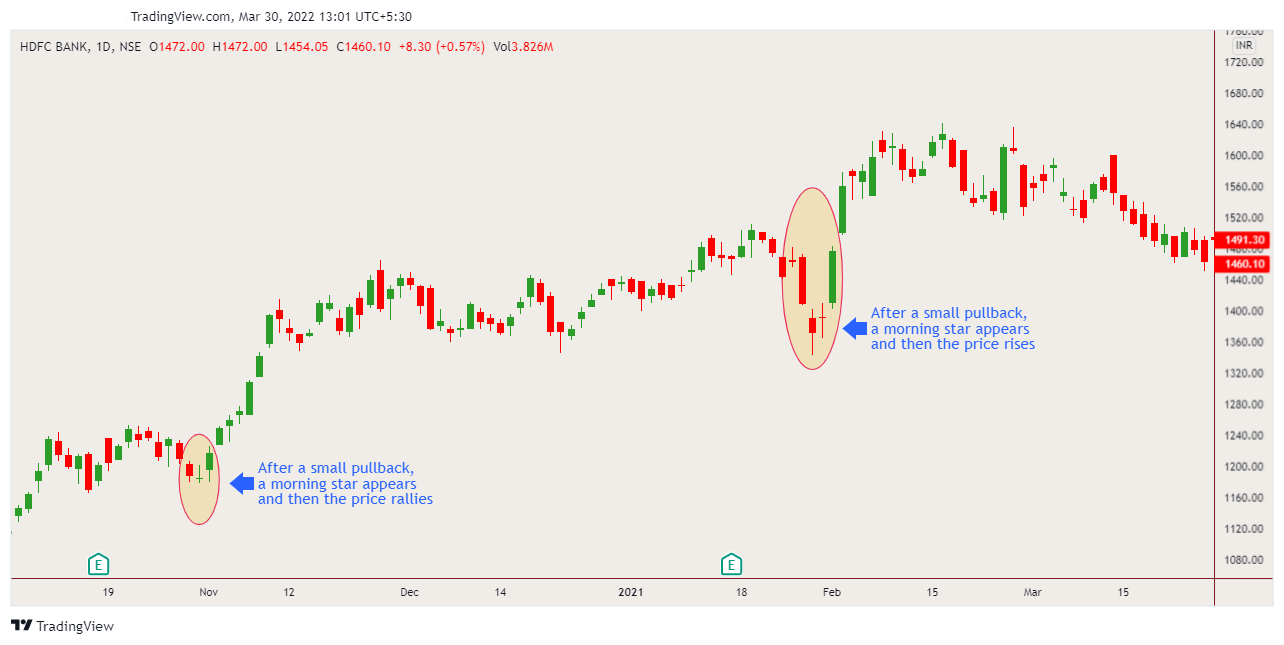
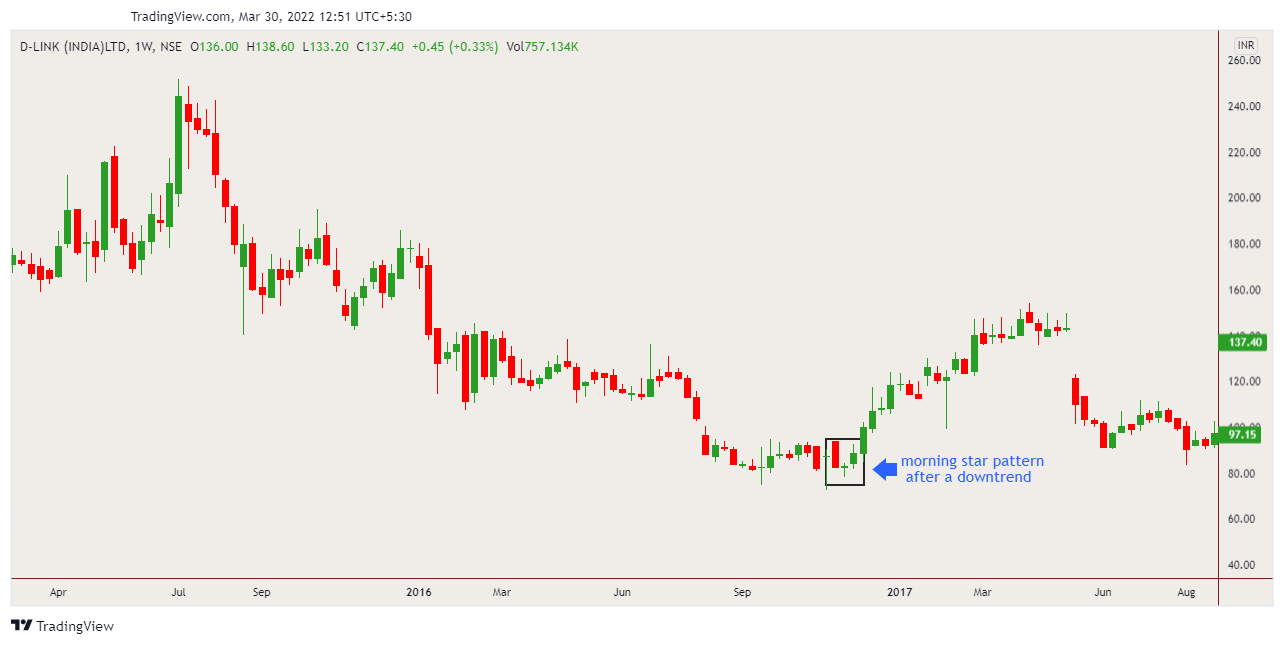
To identify a ‘Morning Star’, the price trend must be in downtrend. The 1st candlestick must be a bearish candlestick with a long body. Then, the 2nd candlestick will be a small candlestick with a small body. This small candlestick can be a bearish or bullish candlestick. In addition, there will be a gap between the 1st and 2nd candlestick’s body. The 3rd candlestick is a bullish candlestick that penetrates significantly into the body of the 1st candlestick. If the 3rd candlestick can pierce and cut across 50% of the 1st candlestick, then the pattern is showing a strong signal of a reversal.
Sometimes, there can be two candlesticks after the 1st candlestick in a downtrend, followed by a bullish candlestick. This can also be considered as morning star, where there are 4 candlesticks put together — a bearish candlestick after a downtrend, two stars, finally a big bullish candlestick.
Furthermore, a trader should keep in mind that the low of the star candlestick (2nd candlestick) is more likely to form the support or major bottom for the price of the scrip.
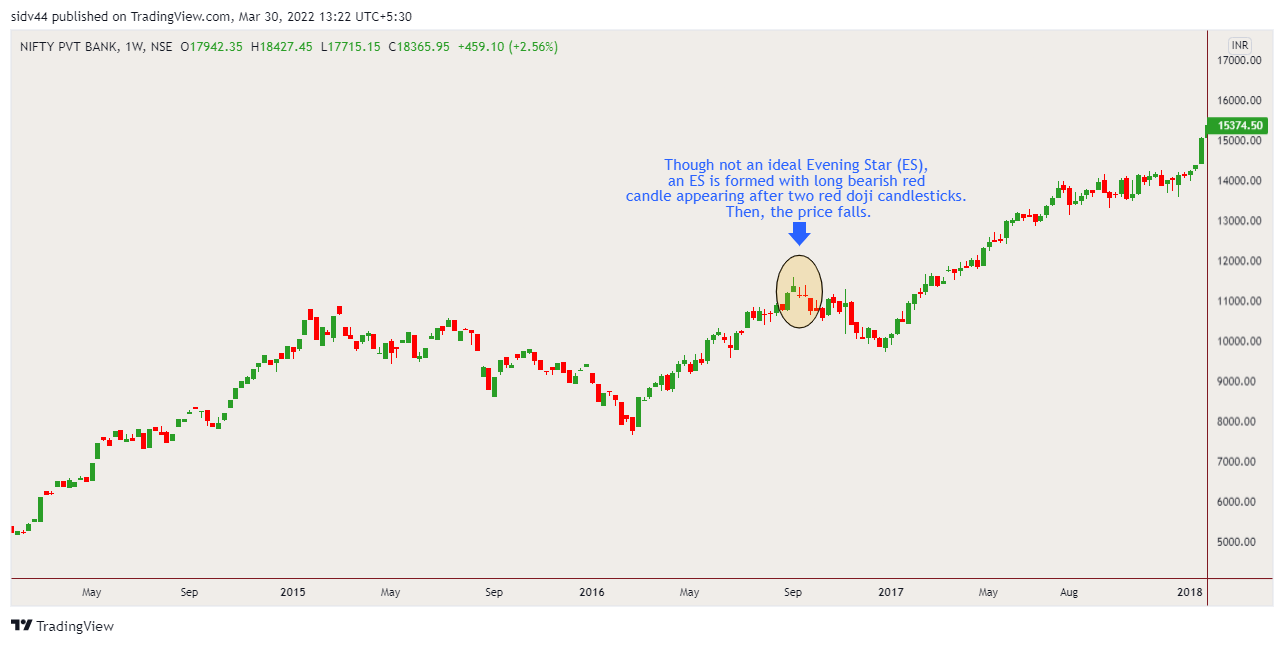
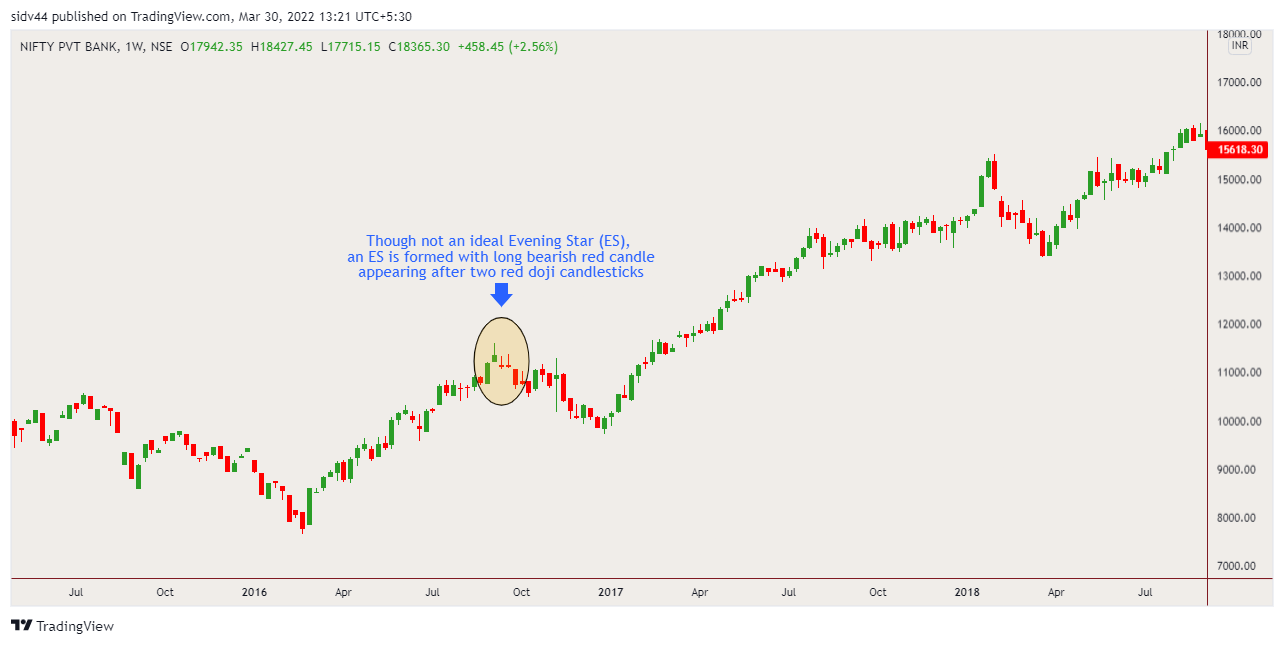
Evening Star
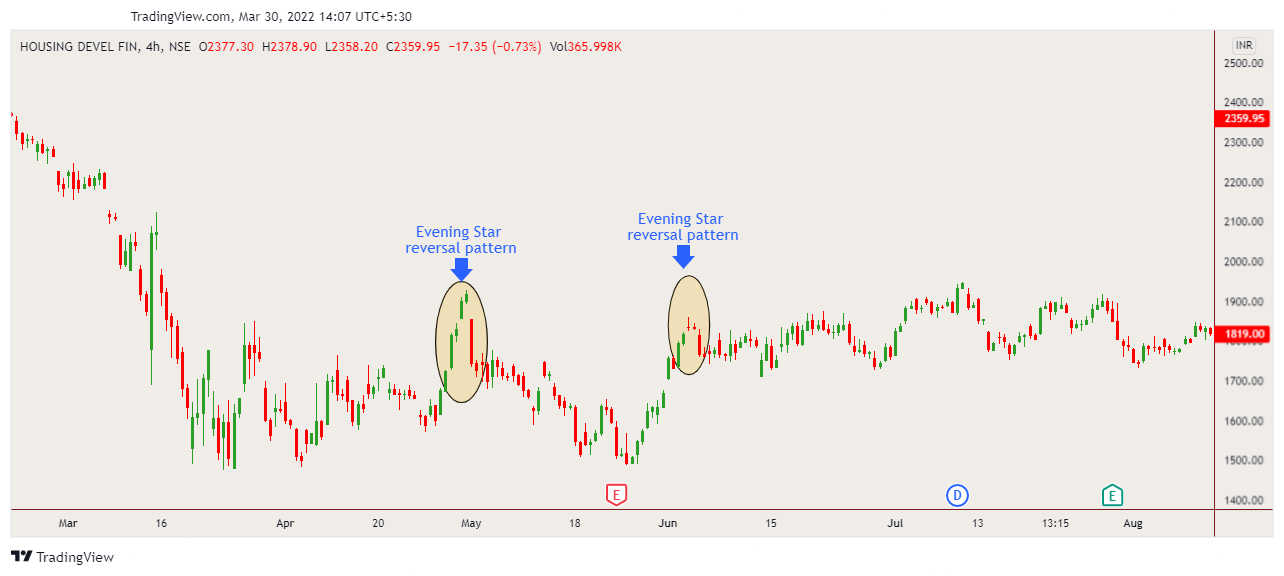
The Evening Star is the opposite of Morning Star. This indicates a top reversal pattern. Since it is a top reversal pattern, we should look out for this pattern after an uptrend. To identify a complete evening star pattern, firstly, there should be an uptrend, then the 1st candlestick should long bullish candlestick followed by a star. This star will be the 2nd candlestick with a small body and the colour of this star is not important. Then the final candlestick will be a strong bearish candlestick that cut deep into the body of the 1st bullish candlestick. The entire pattern is said to be strong, if the 3rd candlestick can cut across more than 50% of the 1st candlestick’s body.
Additionally, if the volume is low when the 1st candlestick is formed and if there is high volume at the 3rd candlestick, then the probability of trend reversal is higher. This volume analysis is a reaffirmation of trend reversal and applicable to both morning star and evening star.
Morning and Evening Doji Star
The Morning and Evening Doji Star is similar to previously discussed patterns but the 2nd candlestick is doji instead of a candlestick with small body and wicks. A doji candlestick is a candlestick with approximately the same opening and closing price with a wick.
When the overall trend is in uptrend and a doji appears, then it is a sign of topping out. Anyway, we must wait for a confirmation candlestick after the doji. The third candlestick must be a bearish candlestick. However, if a white candlestick is formed after the doji, then the potential reversal is negated. Similarly, if in a downtrend, a doji is formed, then it is indication of bottoming out. But, this should be confirmed with a bullish candlestick as the 3rd candlestick. However, if a bearish candlestick appears as the 3rd candlestick, then the downtrend is most likely to continue.
The important point to remember is the doji’s body should be clearly above or below the prior day’s real body. But, this is difficult to find in real world price movements and, hence, there can be some flexibility with candlestick indicators.
To read about other candlestick patterns and reversal patterns, click here