

Every Nifty trader watches price. Very few watch the number that tells you how nervous the market actually is. That number is India VIX – and once you know how to read it, a lot of “why did the market suddenly go crazy today” moments stop being a mystery.
What India VIX actually means
India VIX, or the India Volatility Index, is a number calculated by the National Stock Exchange (NSE) that tells you how much movement traders expect in the Nifty 50 over the next 30 days. It doesn’t look at the past – it looks forward, based on what traders are doing in the options market right now.
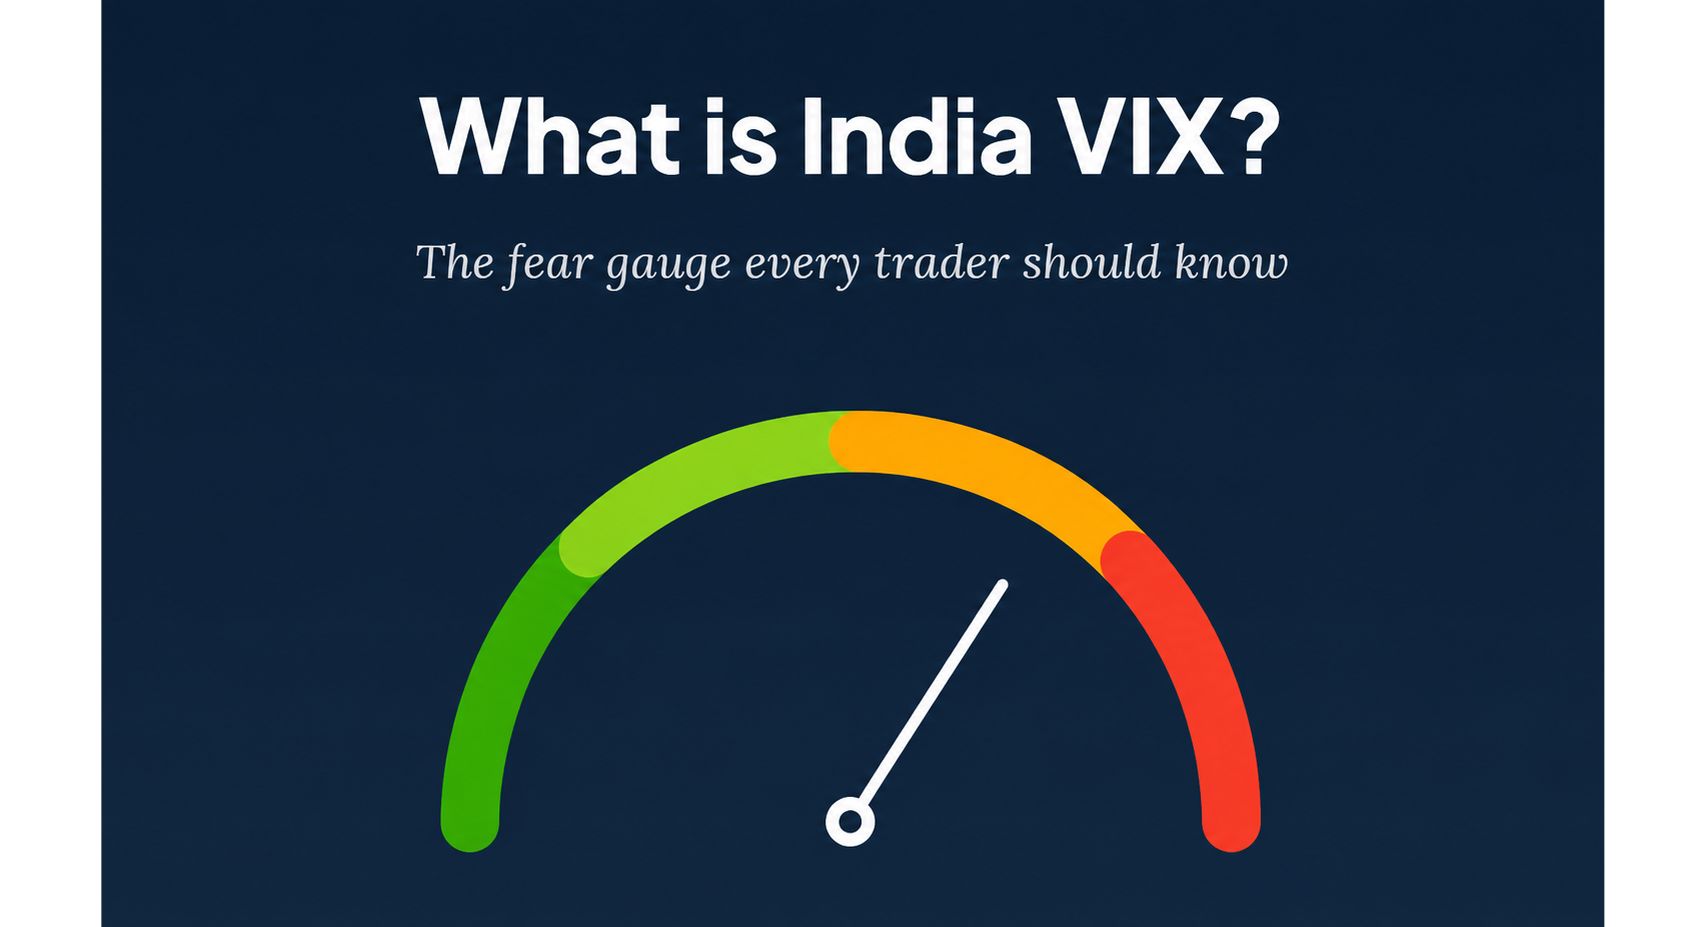
It’s nicknamed the “fear gauge” because of how it behaves: when traders are anxious about what’s coming – an RBI policy decision, a Budget announcement, a global shock – VIX climbs. When the market feels settled and predictable, VIX drifts lower.
India VIX was introduced by NSE in 2008, built on the same methodology the Chicago Board Options Exchange (CBOE) uses for the original US VIX – just adapted for Nifty options instead of the S&P 500.
How is it calculated? (Without the heavy math)
The actual formula involves option pricing models and statistical interpolation – genuinely technical stuff. But the idea behind it is simple enough to picture in one line:
“When traders expect big price swings, they pay more for options. When they don’t, they pay less.”
NSE looks at live prices of Nifty 50 options – specifically out-of-the-money calls and puts, across near-month and next-month expiries. Think of an option like an insurance premium against a price move. If everyone suddenly wants that “insurance,” its price rises. NSE converts that rise in option prices into a single annualised percentage figure – and that’s the VIX value you see on your screen, recalculated roughly every 15 seconds while the market is open.
Reading the fear gauge: what the levels mean
There’s no official NSE rulebook with exact cut-offs, but traders broadly read India VIX levels this way:
A handy shortcut traders use: VIX ÷ √12 gives the expected Nifty move over the next 30 days. So a VIX of 15 roughly implies the market is pricing in a ~4.3% move (up or down) over the coming month. Higher VIX, wider expected swing.
India VIX and Nifty: the inverse dance
One pattern shows up again and again: when Nifty falls sharply, India VIX usually spikes. When Nifty climbs steadily, VIX tends to ease. The logic is simple – when prices fall, traders rush to buy put options to protect their portfolios, demand for those options rises, and that pushes VIX up.
It isn’t a perfect mirror, though. Sometimes both rise together – like when markets climb nervously into a big event. And when a sharp fall stabilises, VIX can stay high even as Nifty starts to recover. Treat it as a strong tendency, not a fixed rule.
How traders actually use it
Sizing up options premiums
High VIX means option premiums are richer across the board. That’s good news if you’re selling options, but it also means buying protection costs more.
Adjusting position size
Many F&O traders treat rising VIX as a cue to trade smaller or widen stop-losses – the same price move means less when bigger swings are already expected.
Reading the mood before big events
VIX often climbs ahead of events like RBI policy meetings, the Union Budget, or election results, then eases once the uncertainty is resolved.
A contrarian signal, used carefully
Extreme VIX spikes have historically coincided with market bottoms – fear peaking right before sentiment turns. It’s a clue, not a guarantee.
What India VIX does not tell you
- It doesn’t predict direction. A high VIX means bigger expected moves – it says nothing about whether those moves will be up or down.
- It isn’t a crash predictor. VIX can stay elevated for weeks without any crash actually happening.
- You can’t trade it directly. India VIX futures were discontinued on NSE. Traders who want a volatility view typically express it through Nifty options strategies instead.
- It only reflects Nifty 50 sentiment. It says nothing specific about an individual stock or sector you might be trading.
Quick takeaways
- India VIX measures the market’s expected volatility in Nifty 50 over the next 30 days – derived from Nifty options prices.
- It’s called the “fear gauge” because it rises with uncertainty and falls when markets feel calm.
- Below 15 is calm, 15–20 is normal, 20–30 is elevated, above 30 is rare panic territory.
- It usually moves opposite to Nifty, but isn’t a perfect mirror.
- It tells you how much the market might move – never which direction.
Ready to Start Investing?
Open a free Demat account with Flattrade – ZERO BROKERAGE ON ALL SEGMENTS. Your first step costs nothing.
Open Free Account