


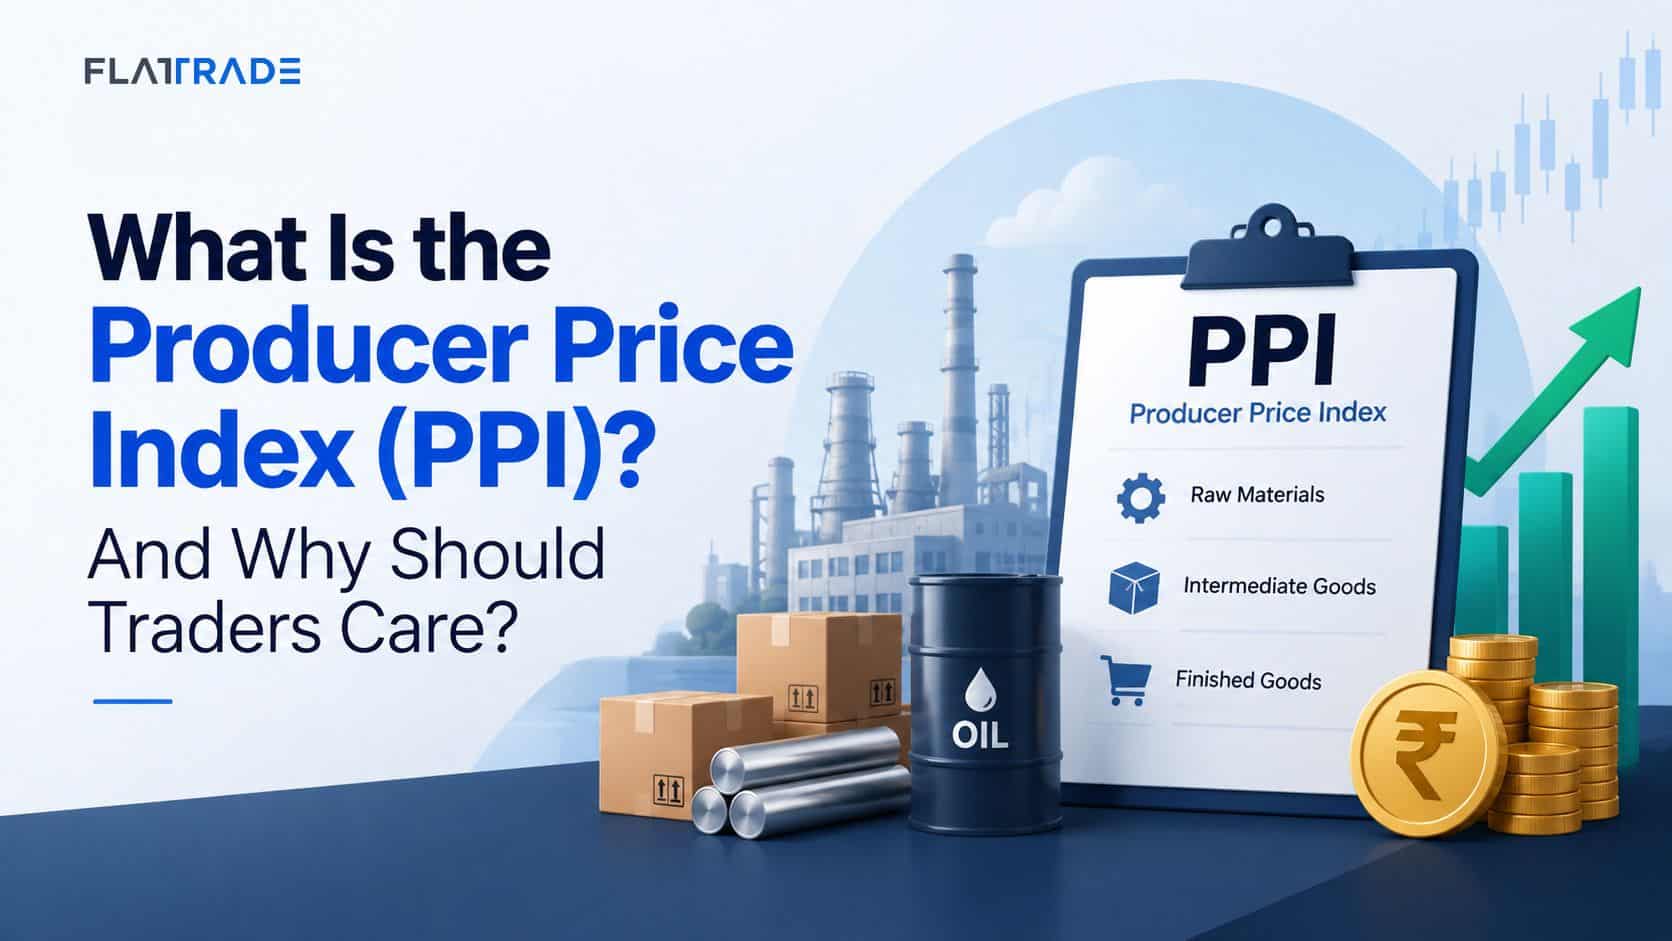
Every month, a handful of U.S. economic data releases move markets within seconds of hitting the wire – jobs reports, CPI, Fed statements. Sitting quietly among them, often overshadowed by its more famous cousin CPI, is the Producer Price Index (PPI). Yet PPI is one of the earliest signals of where inflation is headed, which is exactly why traders, bond markets, and the Federal Reserve watch it closely. If you trade U.S. markets, U.S. – linked commodities, or even just track the dollar and gold for their spillover into Indian markets, understanding PPI is worth ten minutes of your time.
What PPI Actually Measures
The Producer Price Index, published monthly by the U.S. Bureau of Labor Statistics (BLS), tracks the average change in selling prices received by domestic producers for their output. In simple terms: it measures inflation at the wholesale or factory – gate level – the price a company charges when it first sells a good or service, before it ever reaches a retail shelf or a consumer’s hands.
This “upstream” positioning is what makes PPI so useful. If raw material and input costs are rising for producers, those costs tend to get passed down the supply chain to consumers over the following months. That makes PPI a leading indicator, while CPI (Consumer Price Index) is more of a coincident or lagging one.
PPI vs. CPI: What’s the Difference?
It’s easy to lump PPI and CPI together since both measure “inflation,” but they capture different points in the economic chain:
- PPI measures prices at the producer or seller’s level – the first commercial transaction for a good or service.
- CPI measures prices that consumers actually pay at the retail or service level.
Because producer costs often flow through to consumer prices with a lag, economists and traders use PPI as an early read on where CPI – and therefore the Fed’s preferred inflation gauge – might be heading next.
How the Index Is Built
The modern PPI is organized around a concept called Final Demand, which captures the last stop in the production chain before a good or service reaches its end buyer. Final Demand is broken into three broad categories:
- Goods – physical products such as energy, food, and manufactured items
- Services – everything from transportation and warehousing to portfolio management and healthcare
- Construction
Beneath Final Demand sits Intermediate Demand, which tracks prices across four earlier stages of production – essentially following a product’s costs as it moves from raw material to finished good. The BLS also publishes a “core” PPI, which strips out the more volatile food and energy components (and often trade services) to reveal the underlying inflation trend.
Why Markets – and the Fed – Watch It Closely
PPI matters to traders for a few concrete reasons:
It hints at future CPI prints. Rising input costs for producers often show up in consumer prices a month or two later, so a hot PPI report can prime the market to expect a hot CPI report next.
It feeds into Fed policy expectations. The Federal Reserve’s rate decisions hinge heavily on inflation trends. A PPI surprise – hotter or cooler than expected – can quickly shift bets on whether the Fed holds, cuts, or hikes rates, which in turn moves Treasury yields, the U.S. dollar, and equity markets.
It moves currencies, gold, and global risk sentiment. Because PPI data feeds into dollar and rate expectations, its release can trigger volatility in the dollar index, gold, and other commodities – moves that ripple into Indian markets through the rupee, FII flows, and commodity – linked stocks.
It offers sector – level detail. Beyond the headline number, PPI’s breakdown by goods, services, energy, and specific commodities can reveal where cost pressures are building – useful context for anyone tracking global supply chains or commodity – linked trades.
How to Read a PPI Release
When the monthly PPI report drops (typically around the second week of the following month, at 8:30 AM ET), a few numbers are worth focusing on:
- Headline PPI, month – over – month – the broadest measure of change from the prior month.
- Headline PPI, year – over – year – smooths out monthly noise and shows the longer – term trend.
- Core PPI – strips out food and energy to show underlying pressure.
- Goods vs. services breakdown – tells you whether inflation pressure is concentrated in physical products or the broader services economy.
A reading that comes in hotter than economists expected tends to be read as inflationary and can push bond yields and the dollar higher; a cooler – than – expected print often does the opposite.
The Takeaway
PPI won’t grab as many headlines as CPI or the monthly jobs report, but it’s a data point that seasoned traders track precisely because it arrives earlier in the inflation story. For anyone trading instruments sensitive to U.S. rate expectations, the dollar, or global commodities, keeping an eye on the PPI calendar can offer a useful head start on where the bigger market – moving numbers might be headed next.
This article is for educational purposes only and should not be construed as investment advice. Please consult your financial advisor before making investment decisions.