
India’s inflation measured by Wholesale Price Index rose to 11.39% in August on a year-on-year basis, due to higher prices of manufactured goods, according to data released by the Ministry of Commerce and Industry. It stood at 11.16% in July 2021 and 12.07% in June 2021. During August 2020, WPI inflation was 0.41%.
Manufactured products has the highest weightage of 64.23% in the index, followed by primary articles at 22.62%. Fuel & Power has a weightage of 13.2%. These three components make up the index.
The Food Index consisting of ‘Food Articles’ from Primary Articles group and ‘Food Product’ from Manufactured Products group increased to 159.6 in August, 2021, from 159.3 in July, 2021. The rate of inflation based on WPI Food Index decreased from 4.46% in July, 2021 to 3.43% in August, 2021.
Inflation in food articles eased registering (-) 1.29% in August. Inflation rate of onions was high at 62.78%, while potato prices fell 39.81%.
CARE Ratings in a note said that food inflation has been showing signs of easing. Satisfactory monsoons, good kharif sowing season, easing of supplyside pressures would soothe the inflation over the coming months to some extent.
The agency added that price fluctuations of crude oil in the international markets and increase in prices of edible oils and metal products would result in higher wholesale inflation due to India’s position as a price taker for most of these commodities.
Trade Data
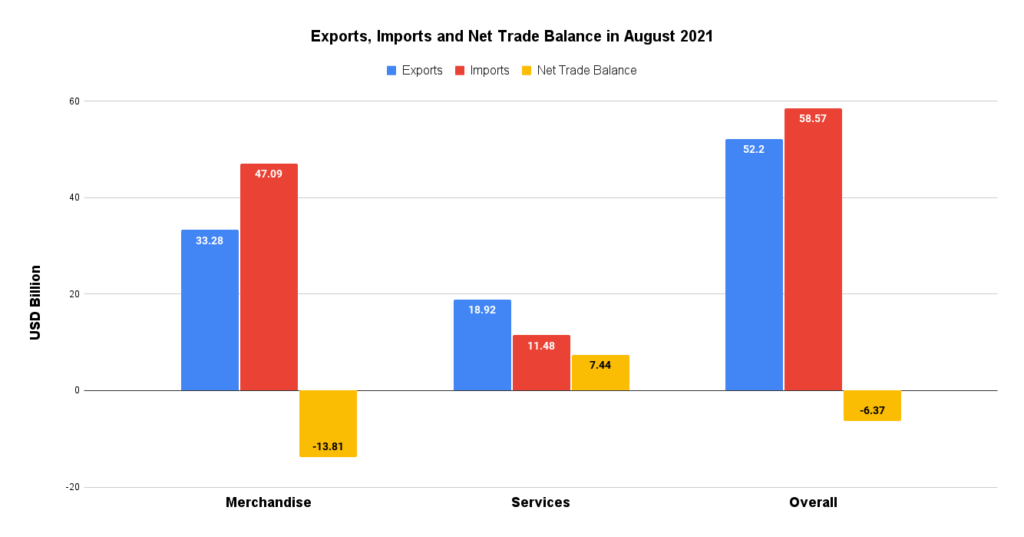
The ministry also released trade data which showed overall trade deficit increased to $6.37 billion in August 2021, from $ 1.33 billion in August 2020.
Overall exports which includes merchandise and services segment jumped to $52.20 billion in August 2020, from $38.96 billion in the same period last year.
Overall imports rose to $58.57 billion last month, from $40.29 billion in the corresponding period previous year.
In merchandise segment, trade deficit increased to $13.81 billion in August 2021, compared with $8.20 billion in August 2020.
In services segment, there was trade surplus of $7.44 billion, compared with $ 6.88 billion in the year-ago period.
The image below show the trade data for the month of August 2021.
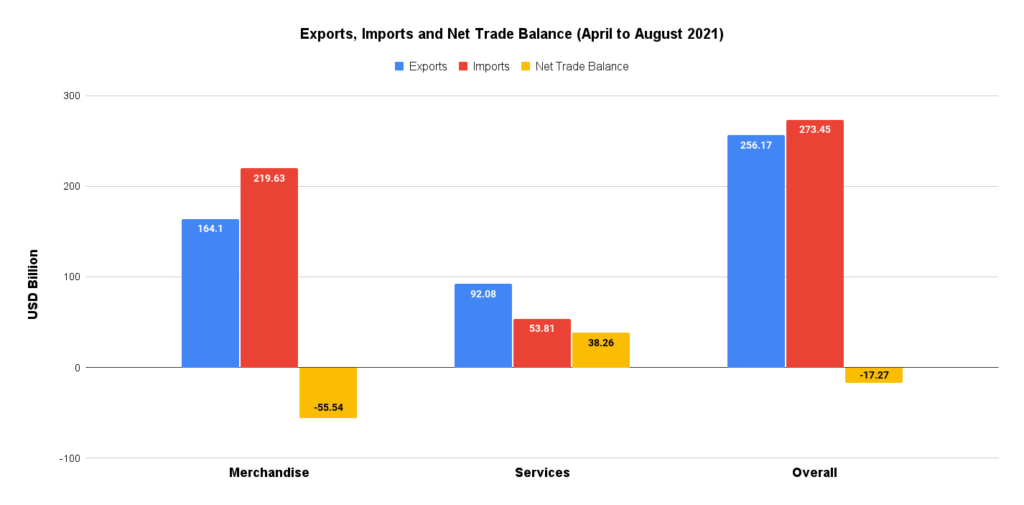
The image below gives you details about trade data from April to August in fiscal year 2022. It shows the segment-wise details of exports and imports. The two segments are merchandise and services.
To read more about CPI inflation, which is also known as retail inflation, click here