
The domestic stock market has been in a downtrend for the past few weeks due to a host of reasons and bears have tightened their grip further. Now it is a good time to look at what is a bearish candlestick pattern and its interpretation.
Bearish candlesticks are generally represented by red or black colour candlesticks and it is formed when open price is higher than close price in a given timeframe. A candlestick can represent a timeframe anywhere between one second and one month.
The formation of a bearish candlestick tells the trader that the sellers were in a dominant position and the buyers were unable to fight the sellers and push the price of the security higher.
There are a few bearish candlestick patterns which indicates the downward direction of the price of a security. The formation of a bearish candlestick is not a 100% guarantee that the trend is going to change but it is a mere indication that the price is expected have a pullback or the price is likely to decline.
This is applicable to all kinds of securities and it is important to keep in mind that the patterns should not be viewed or analysed in isolation. The overall trend, price action and other indicators must be taken into account with candlestick patterns to decide on the next move by the trader. Let us have a look at some important bearish candlestick patterns.
Bearish Engulfing
This pattern is formed when a big red candlestick will engulf a smaller green candlestick. The first candlestick must be a green colour and the second candlestick must be a big red candlestick. The opening of the red candlestick (2nd candlestick) must be higher than the 1st green candlestick and the closing of the 2nd candlestick will be lower than the 1st candlestick.
This is one of the most powerful candlestick patterns, but it is not formed frequently. If it happens in an uptrend then the probability of a trend reversal is higher or at least there will be a pullback before the price bounces back.

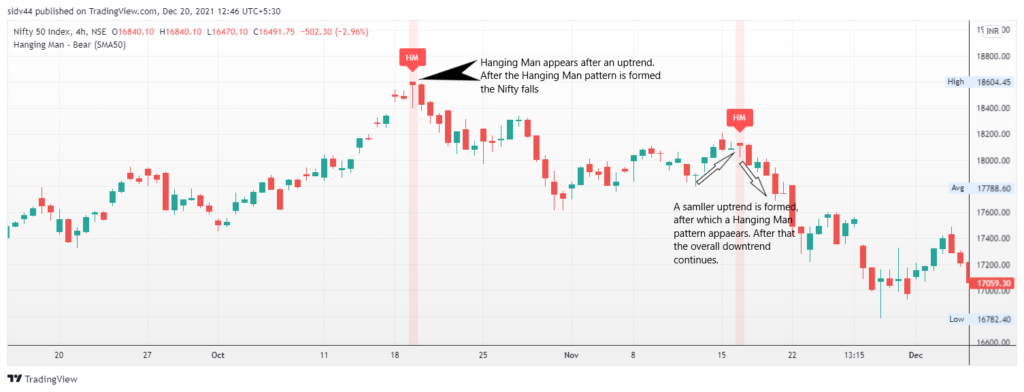
Hanging Man
Hanging man pattern is a bearish pattern and it appears in an uptrend. It looks exactly like a hammer pattern but it should be formed in an uptrend. Otherwise, it is not called as a Hanging Man pattern. The candlestick will have a small squarish body and longer lower wick. Generally, the lower wick will be twice or more longer than the length of the body. The colour of the candle stick is bot important here. The Hanging Man can be red or green colour.
This tells the traders that the buyers have lost their strength in pushing the price further upwards and the price is most likely to reverse direction. If this happens near a resistance line in an uptrend, then it will be a beginning of a downtrend or a definite pullback in security’s price.
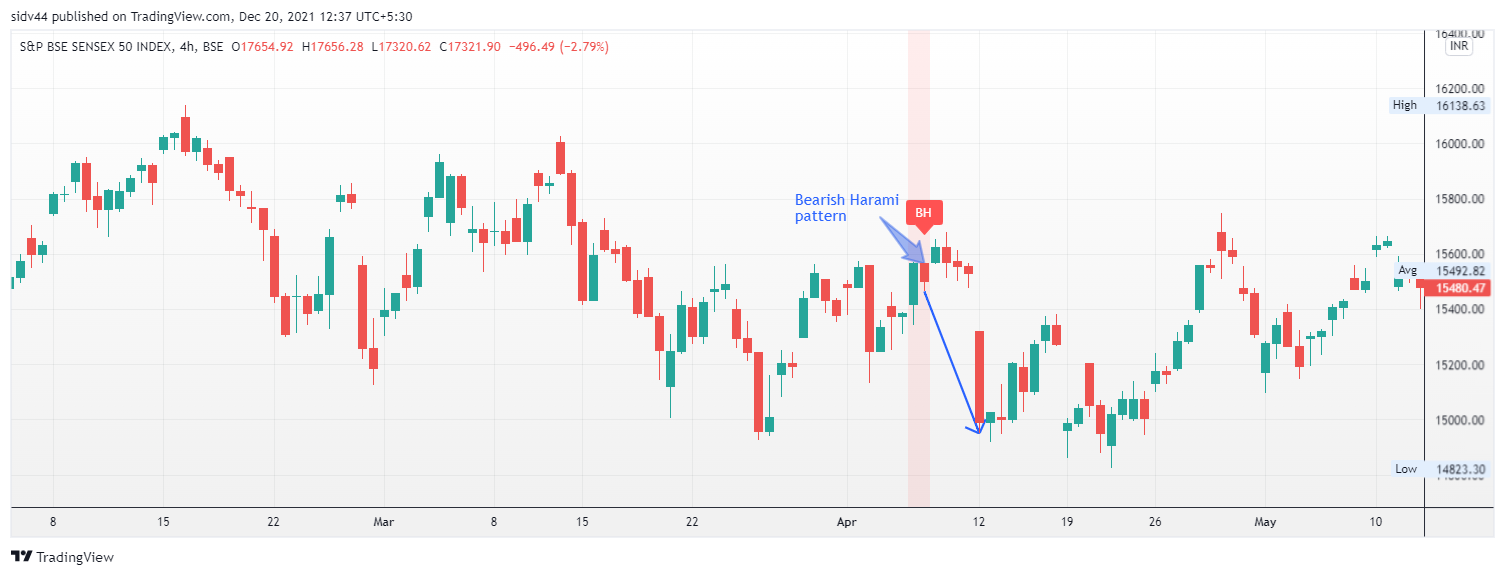
Bearish Harami
A pattern is called a Bearish Harami when the first candlestick is a big green candle and the subsequent candle is a smaller red candle. This is sort of a mirror image of an engulfing pattern. The 1st candle will be engulfing the 2nd candle. Here again, if it happens near a resistance level, then the probability of the price going in the downward direction is higher.
Bearish Pin Bar
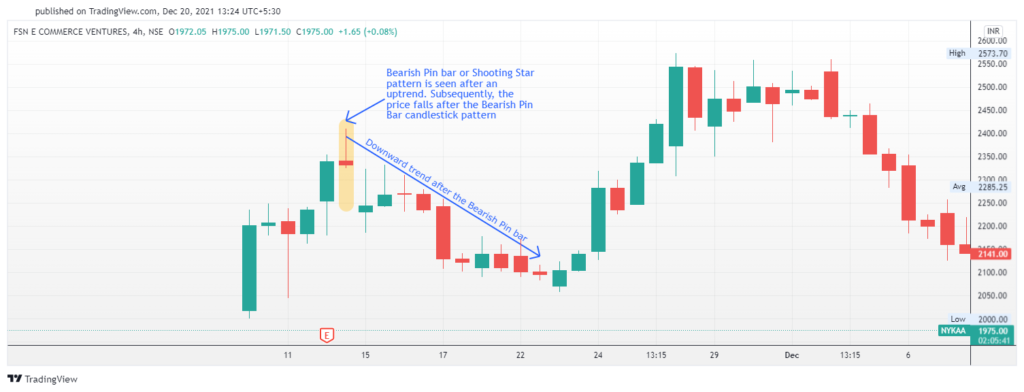
A bearish pin bar is also know as shooting star in the trading world. It is a bearish reversal chart pattern. The characteristics of the candlestick is a long upper wick, a very small body and no lower wick. Sometimes, this lower wick will be negligible.
This bearish pin bar is a single candlestick pattern and it will appear in an uptrend and at a key resistance level. Then, you can infer that the price is about to change direction. The bearish pin bar must appear in an uptrend which is the most important criteria for the direction of the price to change.
Resistance and Support are two key and critical price levels a traders must always keep a watch. Resistance level is that level where a price is unable break above that level and the price moves downward after reaching that resistance. Support is the opposite of resistance. The price of a security does not go below the critical level and the price finds support at that key level.