On-Balance Volume (OBV) is a technical momentum indicator which determines the volume of a scrip and its impact on the price of a scrip. The indicator measures the buying and selling pressure as a cumulative indicator during a day or ...
The domestic stock market has been in a downtrend for the past few weeks due to a host of reasons and bears have tightened their grip further. Now it is a good time to look at what is a bearish ...
Doji is a candlestick pattern which denotes that neither the buyers nor the sellers are in control and also represents the market’s indecisiveness with respect to price. A Doji candlestick pattern can lead to reversal of trend or the main ...
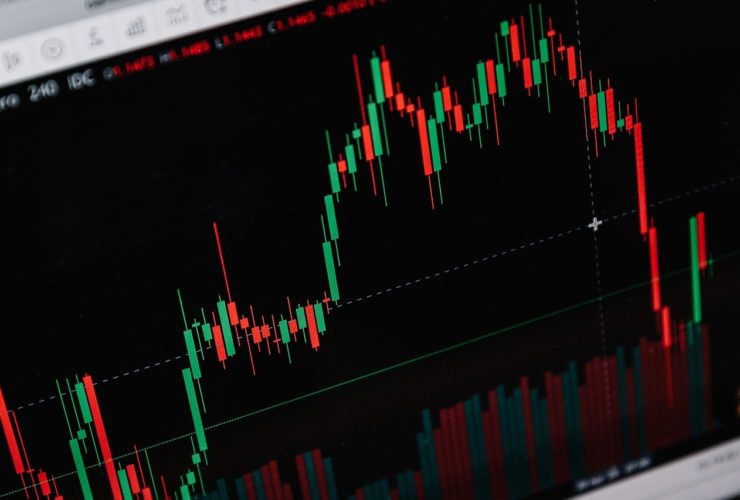
Candlestick patterns are good indicators to determine whether there is a reversal of price or we can confirm the price trend. Candlestick should not be used singularly while trading. It should be combined with other indicators or price actions to ...
Technical analysis is one of the forms of analysing a financial security through chart patterns and determining the price trend of a particular security or predicting the direction of an index. Technical analysis involves reading price action, price history, volume ...

