Candlestick patterns are good indicators to determine whether there is a reversal of price or we can confirm the price trend. Candlestick should not be used singularly while trading. It should be combined with other indicators or price actions to confirm the entry or exit in a trade and then make a decision.
There are a number of candlestick patterns available, but we will take a look at the most important and popular patterns that are used by traders and investors. Firstly, we will take a look at candlestick patterns that will give you bullish signals.
Bullish Engulfing
This is one of the most popular candlestick patterns used to determine trend reversal. Please take a look at the below image which shows a bullish engulfing pattern. The first candle is a bearish candle and the second candle is a bullish candle. The second candle must be bigger than the first candle.
The open and close of the second green (bullish) candle must engulf the first red (bearish) candle. In other words, the 2nd candle’s body must be bigger than the 1st one. The signal becomes stronger if there are three or more red candles before the green engulfing candle. In addition, this must appear in a downtrend.
The bullish candle’s open price will be lower than the previous red candle’s open price. Furthermore, the bullish candle’s closing price will be nearer to the high price of the day or any other timeframe. This pattern is applicable to any timeframe, be it daily timeframe, 1 hour, etc.
This pattern also says the bulls have taken control. Once this happens, then there will be an uptrend. Please take a look at the below image which shows a bullish engulfing pattern.
Hammer
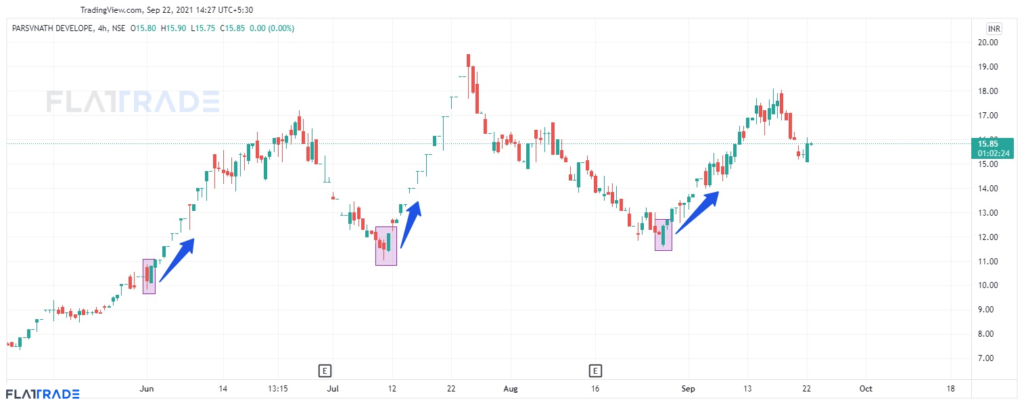
Hammer pattern is another bullish signal pattern and investors who are looking to go long must identify this pattern in a technical chart. The hammer candle will have a smaller body in the top and the wick must be longer. The length of the wick must be 1.5 times or 2 times the body.
When this type of candle appears in a downtrend or at a critical support, then the chances of a trend reversal in prices are higher. Here, colour of the candle is not important. It can be green or red.
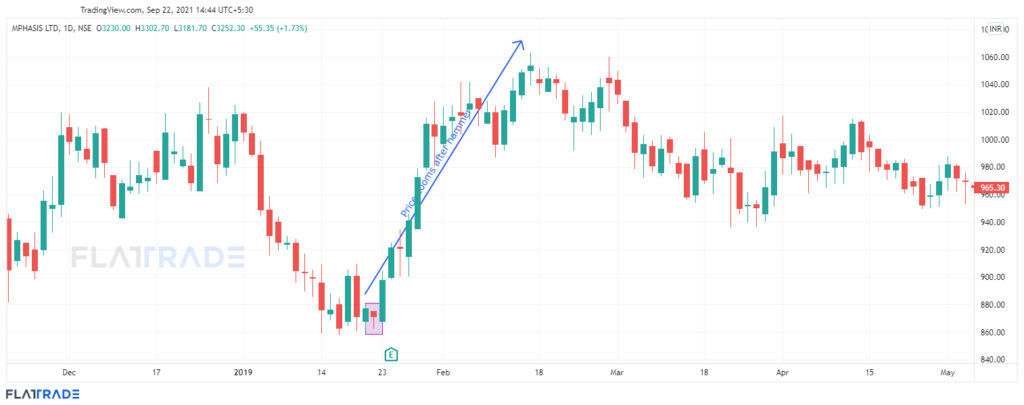
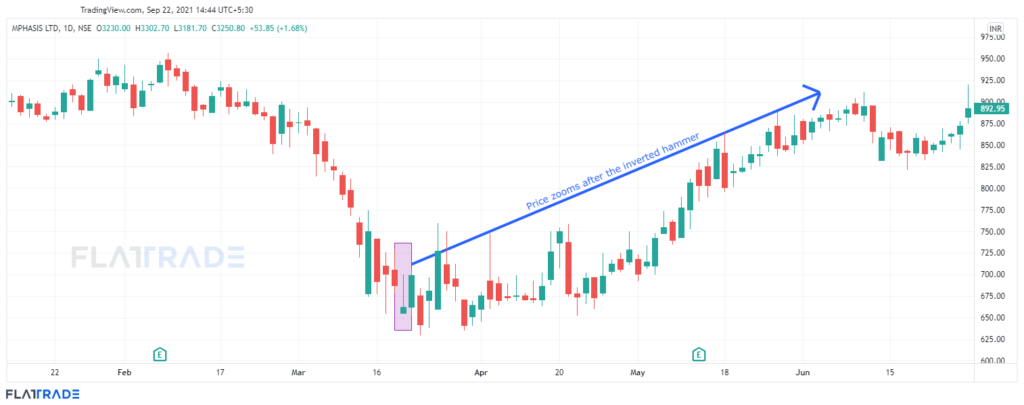
Inverted Hammer
This is similar to the hammer candle. This looks like a hammer pattern upside down. The colour of the pattern is not important. The real body will be at the bottom and the candle will have a long wick on top of the body.
Normally, the body should not be too thin. It must be a little squarish or the small body must be visible when you see at the technical chart. Here also the wick length on top must be 1.5 times or 2 times the body size.
For the signal to be stronger and a reversal in price trend, it must appear in a downtrend.