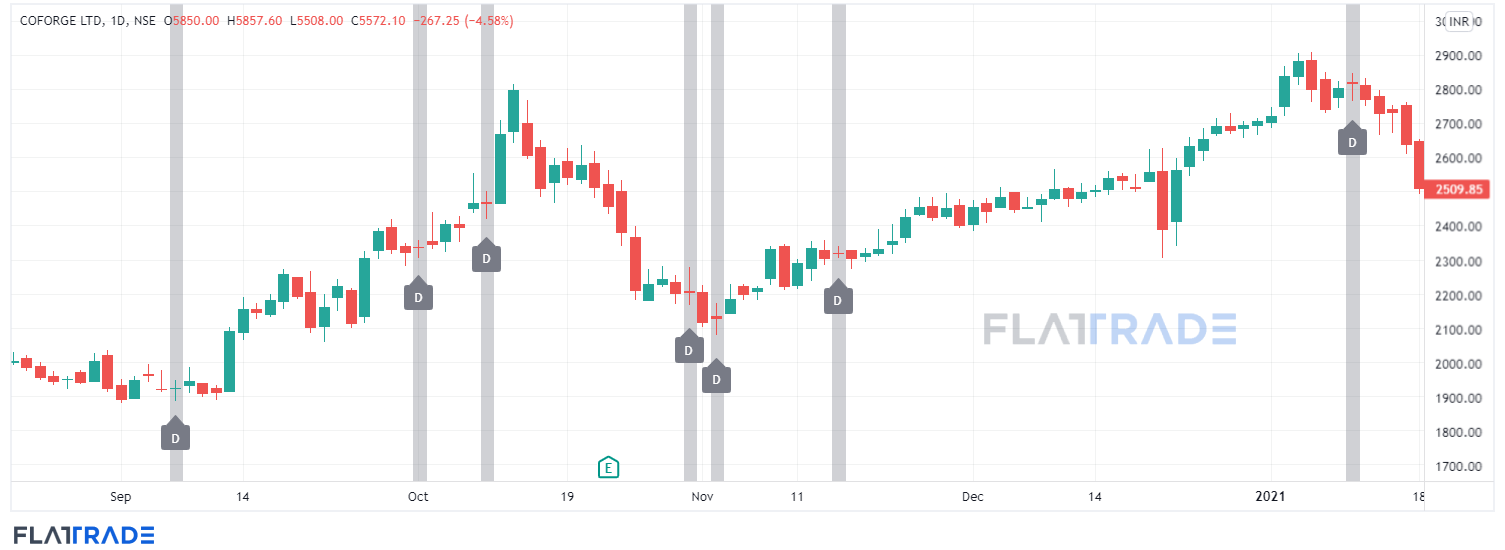
Doji is a candlestick pattern which denotes that neither the buyers nor the sellers are in control and also represents the market’s indecisiveness with respect to price. A Doji candlestick pattern can lead to reversal of trend or the main trend (up trend or down trend) can continue. So it is important for you to look at other signals along with Doji.
In a Doji, the open price and close price are almost the same price. The Doji also has a medium to longer wick at the top and at the bottom. Sometimes, there will be no wick. Only a body with open and close price that will also be almost the same value. This will be just like a minus sign (-).
The Doji must not be looked in isolation. It should be viewed along with prior candlesticks or price action leading to a Doji.
There are different types of Doji. We will look at the most important Doji patterns in this blog with examples.
Standard Doji
A standard Doji is a candle stick pattern where a wick can be found on the upper side and bottom of the body. The body represents the range between the open price and close price. Here, the body will look like a minus sign with a wick on either side. The open and close price will be somewhere in the middle of the high price and low price of the candlestick. The time frame can be anywhere from 1 second or 1 minute to 1 month. This standard Doji is also called as common or neutral Doji.
* To see the enlarged image, right click on the image and open in new tab
Long-legged Doji
This type of Doji is formed when the open and close price is above or below the mid range of the price. The open and close price is closer to highest price or lowest price of the time period of the candlestick.
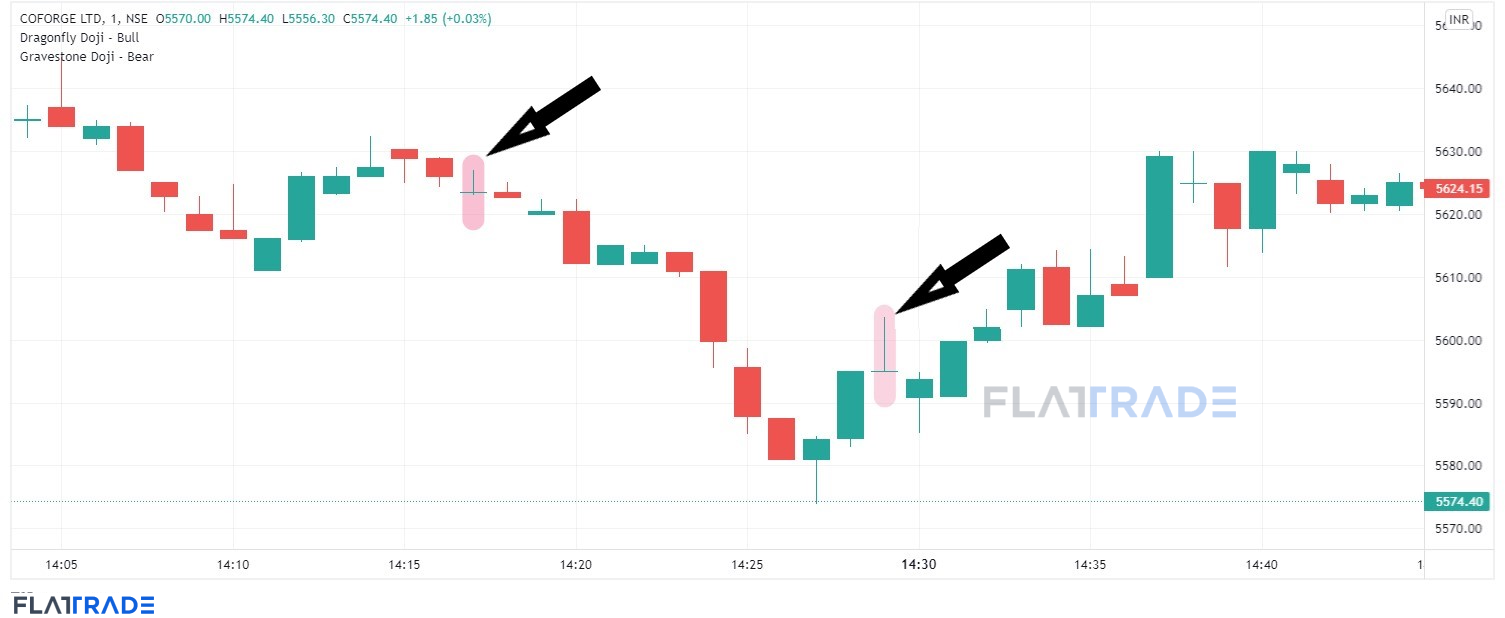
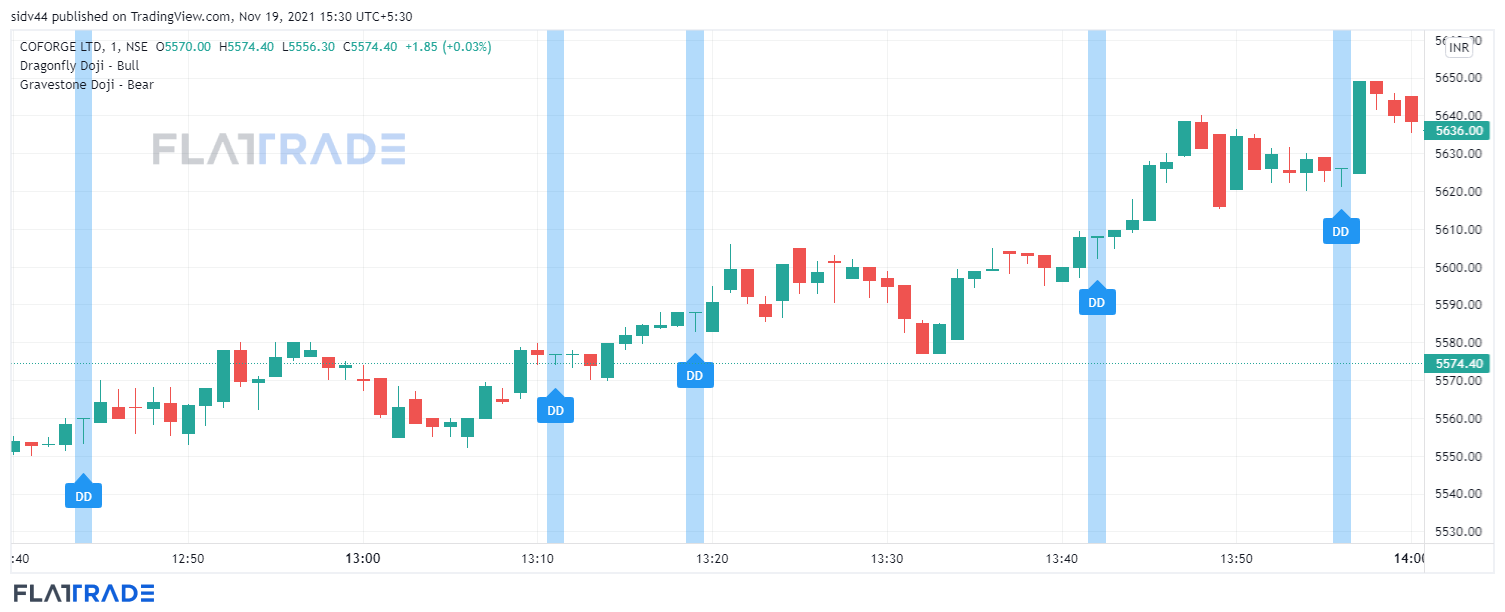
Gravestone Doji
The stock opens and closes almost near the day’s low or at the day’s low. So the open price, close and day’s low will all be almost the same value. This will have a long upper wick. This also signals that the market has rejected the higher price.
Dragonfly Doji
The stock opens and closes almost near the day’s high or at the day’s high. So the open price, close and day’s high will all be almost the same value. This will have a long lower wick. This also represents the market has rejected the lower price.
To know more about the bullish candle stick patttern click here