

On-Balance Volume (OBV) is a technical momentum indicator which determines the volume of a scrip and its impact on the price of a scrip. The indicator measures the buying and selling pressure as a cumulative indicator during a day or session.
The OBV number is calculated by adding the volume on days when the price ends higher compraed to the previous day and subtracting the volume on days when the price ends lower. When the security closes higher than the previous close, all of the day’s volume is considered up-volume. When the security closes lower than the previous close, all of the day’s volume is considered down-volume.
Using the OBV indication a trade can gauge the relationship between volume of a scrip and the price of that scrip. The OBV indicator gives you the net volume figure after adding or subtracting the volume of the day/session to the cumulative volume figure and confirms the price trend.
How to interpret OBV indicator
If share prices are rising along with OBV, increased volume is reflected by the buyers, even at higher price levels and the trend would be bullish. Meanwhile, if price and OBV are declining, it shows stronger volume from sellers and lower prices should continue.
Further, if OBV indicator is increasing and the share price is marginally range-bound or stable, mostly, at lower support price area, then investors/trader are in accumulation stage. This would indicate a rise in share price in the near- or medium-term.
Conversely, if prices are moving sideways and OBV indicator is falling, then it shows. Investors/ traders are in distribution stage. This would have bearish implications, especially at high price levels.
Moreover, if the price of the security and the OBV indicator is making higher peaks and higher troughs, the upward trend is going to continue. In contrast, if the security price and the OBV indicator is making lower peaks and lower troughs, then downward trend is going to continue.
The general assumption with respect to the OBV indicator is that OBV changes before price changes. This is because smart money is flowing into a scrip by a rising OBV. When the retail investor starts buying a security, both the security and the OBV will rise. Similarly, when smart money is flowing out represented by a falling OBV, then the retail investor will start selling the security. Now, both the security and the OBV will fall confirming the downtrend.
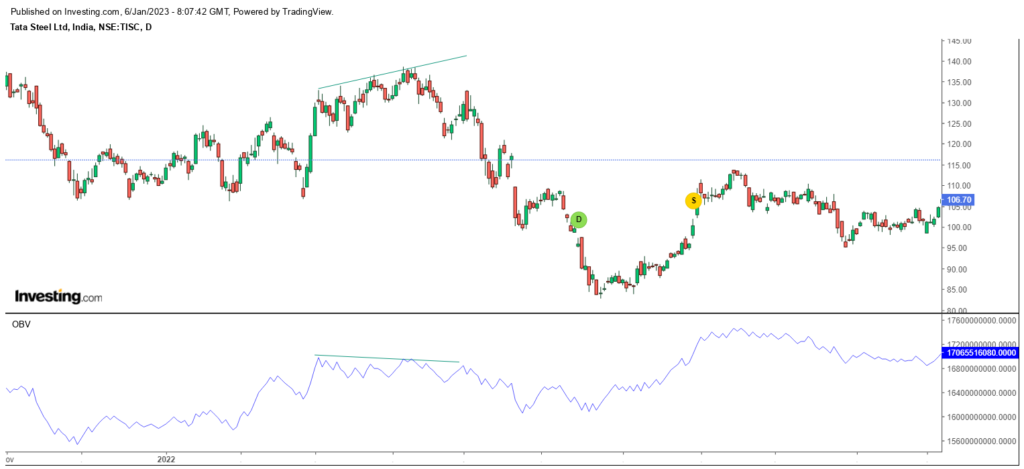
OBV indicator can be used for divergence signal. In the above chart, Tata Steel share price rises, while the OBV indicator falls. After that, the price of Tata Steel also declines. When the OBV diverges from the direction of a security’s price movement, it may be an indicator of a possible trend change. When used with another momentum indicator like MACD, increasing or falling levels of the OBV indicator gives a stronger confirmation about the current price trend.
However, OBV is a leading indicator and it is likely to give you false signals sometimes. In addition, during extreme volatile sessions, the OBV indicator may not be useful and it will not represent the trend.