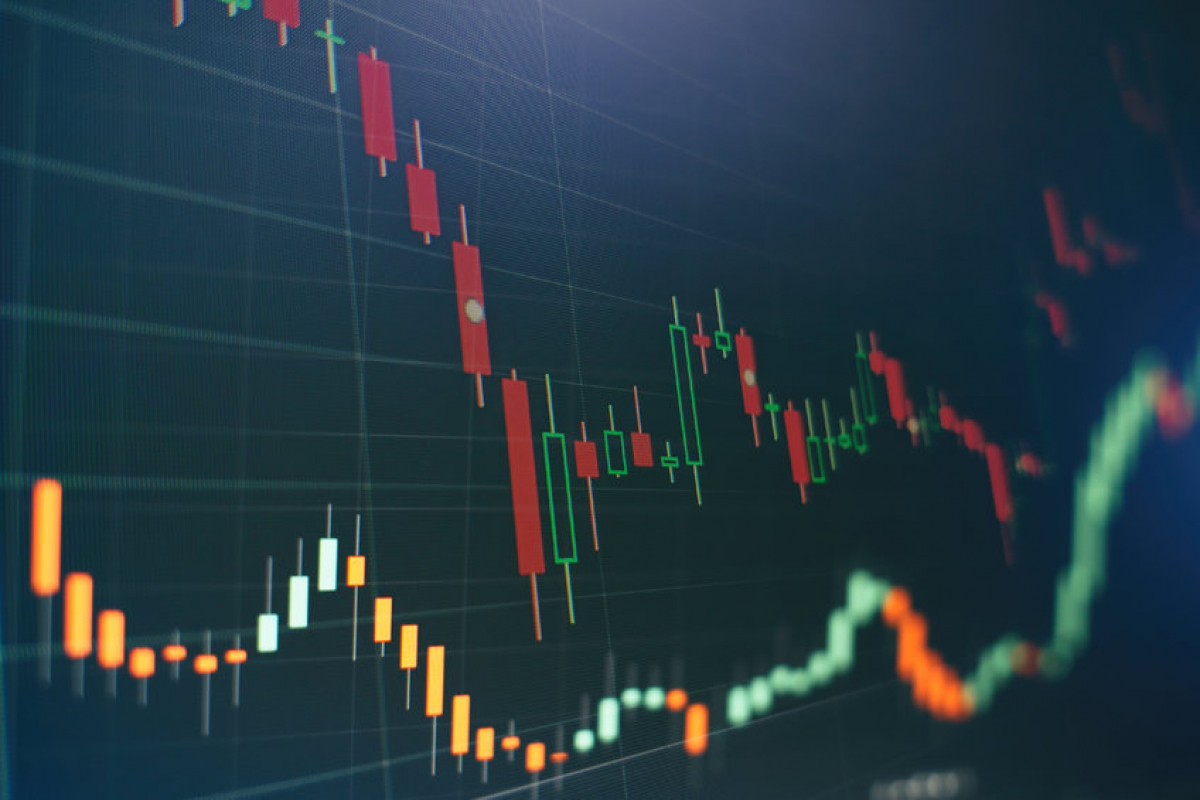


Technical analysis is one of the forms of analysing a financial security through chart patterns and determining the price trend of a particular security or predicting the direction of an index. Technical analysis involves reading price action, price history, volume traded in the security and overall trend of the price of the security.
All these past data is used to predict the direction of the price of the security by investors and traders. Technical charts also give an idea about entry and exit points for a security. Though, there are no right entry or exit points, it helps investors to gauge the mood of the traders and investors in the market.
Since technical analysis is based on prices in the past, there are a few presumptions which are believed to be true for decision making. Firstly, price of a security reflects all publicly available information. Secondly, prices always move in a trend. They can be uptrend, downtrend or sideways. Finally, it always forms a pattern, which is repetitive or similar to a pattern that occurred in the past.
Technical analysis not only depends on charts depicted as candles, bars or line charts, but, it also includes a host of indicators. These indicators provide more information and tools for traders to analyse the data to make informed decisions, while charts show the traders information like open, high, close and low levels of prices of a security. Even volume data has charts and exclusive indicators to analyse volume information.
Brokerages across the world have their own charting tools and some names like TradingView or ChartIQ charting software have gained popularity among retail traders and remains one of the widely used charting tools. With the advent of discount brokerages around the world, most brokerages and companies in this field have started to incorporate these charting software in their website to provide to their clients.